This is called the friendship paradox. This phenomenon states that most people have fewer friends than their friends have, on average. In this article, I will demonstrate why such a paradox exists, and whether we can find the paradox in Facebook data.
Minimal example
To understand why the friend paradox exists, let’s start with a minimal example. We will create a network of people. Two people are friends if they are listed in the same Python tuple.
Now we will use Pyvis to visualize the network.
If you move the nodes around, you can see that Ben is the center of the circle of friends. We are interested in finding what percentage of people in this network have fewer friends than their friends do on average. We will create multiple functions that help us answer this question. The functions are:
Get friends of a specific person:
For example, Lauren’s friends are:
Get the numbers of friends a specific person has:
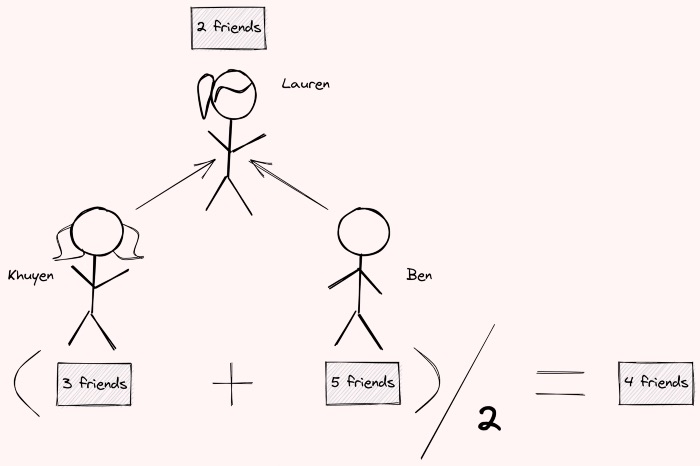
The result shows that Khuyen has 3 friends and Ben has 5 friends.
Get the number of friends a person’s friends have on average:
The output shows that the number of friends Lauren’s friends have on average is 4, which is higher than the number of friends she has. If we observe the picture above carefully, we can see that Ben’s number of friends gives a boost to the number of friends Lauren’s friends have on average. Since Ben has many friends, many of his friends will be in a similar situation as Lauren. In other words, the number of friends their friends have on average is higher than their number of friends because one or two of their friends are the influencers.
Get the number of friends for all people in the network
In the table above,
The column num_friends shows the number of friends a person has. The column avg_friends_of_friends shows the number of friends a person’s friends have on average. The column friends_have_more_friends indicates whether a person’s friends have more friends than himself/herself on average.
Let’s find out what percentage of people in the network have fewer friends than their friends have on average.
Analyze Facebook network
The Facebook data consists of friend lists from Facebook. Facebook data was collected from survey participants, and the users in this data have been anonymized. You can download the data from here. After downloading the data, unzip and save it as facebook_combined.txt
We will use the previous functions to get the number of friends people in the network have.
Let’s find out what percentage of people in the network have fewer friends than their friends have on average.
87% of people in the network have fewer friends than their friends have on average!
Visualize the influencers
Which nodes are the influencers in the network? Let’s visualize them using Pyvis. Start with adding nodes to the network.
We will define influencers as those who have more friends than their friends have on average. We will mark the nodes that are defined as influencers in red.
Add edges and show the network graph:
As we can see, the red nodes (people who have more friends than their friends have on average) tend to be in the center of the graph. If we move a red node, many blue nodes will move with it. This indicates that these red nodes are the influencers of one or two subgroups in the network.
Conclusion
Congratulations! You have just learned what the friend paradox is, and how to observe this paradox in Facebook data using Python. I hope this article will give you the motivation to observe other paradoxes around you using visualization and data science techniques. Feel free to fork and play with the code for this article in this repo. This article was originally published on Towards Data Science, you can find it here. Khuyen writes about basic data science concepts and enjoys playing with different algorithms and data science tools. You can connect with them on LinkedIn and Twitter.